2024 Market Outlook
Executive Summary
Get ready for more fun in 2024 as presidential politics joins the party as investors contend with fiscal spending, a steadfast Fed and the wars in Israel and Ukraine.
We look for the U.S. economy to inch along in the first half of 2024 as the lagged effects of monetary tightening restrain output. Market interest rates will likely remain elevated as global investors demand higher coupons in the recently downgraded U.S. Treasury market, where issuance continues to expand.
Fortunately, corporate profits are set to gain traction as we expect market growth to reflect earnings gains. Our base case scenario has the S&P Index fairly valued in the 4,750 range by year-end 2024.
In these volatile times, we will continue to position our clients’ assets in fully diversified strategies, consistent with their long-term investment objectives.
Policy
The Fed may be done, but Treasury is not!
- At ~6.0% of national economic output, the budget deficit is a striking development when considering full employment in the U.S.
- After borrowing more than $1 trillion in the fiscal fourth quarter (September 30th) the Treasury department announced expected issuance of $776 billion in the current quarter and $824 billion early next year.
- We remain concerned over the increased supply of Treasuries and rising federal interest costs.
- The Federal Reserve held their policy rate steady (in the range of 5.25% to 5.50%) for the second consecutive meeting on November 1st, suggesting that rates would remain elevated well into next year.
- To the degree the Fed holds rates “higher for longer” over the next several quarters, we believe monetary policy can remain restrictive as any improvement in core inflation measures will lead to higher inflation-adjusted, or “real” interest rates, therefore restraining credit.
Economy
It is hard to have recession when everyone who wants a job has a job.
- The U.S. economy managed to absorb a variety of challenges thus far in 2023 and we attribute this surprising economic resilience to employment and the money supply (M2), which is ~30.0% higher than it was prior to the outbreak of Covid-19.
- Considering the impact of rising market interest rates, the possibility of another government shutdown and escalating geopolitical tensions, it is conceivable demand moderates in the months and quarters ahead.
- Comerica Bank Chief Economist Bill Adams projects real GDP growth of just 0.7% and 0.5% for the fourth and first quarters, respectively. For all of 2024, he projects real GDP growth of 1.4%.
- The Consumer Price Index (CPI) was unchanged in October, bringing the year-over-year (YOY) reading down to 3.2%.
- The inflation fever has broken in the U.S., according to Adams, who projects CPI growth of 2.5% next year.
Fixed Income
The Treasury Yield Curve still points to recession, but corporate bonds suggest it will not be so bad.
- Investors have faced another challenging year in the bond market. Treasury yields plunged last spring on banking industry stress before surging again over concerns of inflation and monetary policy. Hopes for a soft-landing combined with escalating geopolitical tensions recently led to a renewed bid for government bonds.
- While optimism prevails in the bond market for 2024, we are less enthusiastic than the consensus as the Fed remains steadfast and demand wanes from traditional buyers amid an increased supply of Treasury bonds.
- Fortunately, corporate credit spreads indicate a better outcome for the economy than the Treasury yield curve suggests.
- After three challenging years, we look for “coupon-type” returns in bonds to support diversified portfolios in 2024.
Equities
Regarding valuation, the “E” must substantiate the “P” in P/E ratios.
- It was another volatile year in the equity markets, as optimism over declining inflation, monetary policy, and artificial intelligence (AI) propelled the major indexes higher. Momentum recovered and large caps outperformed small, while growth significantly outperformed value.
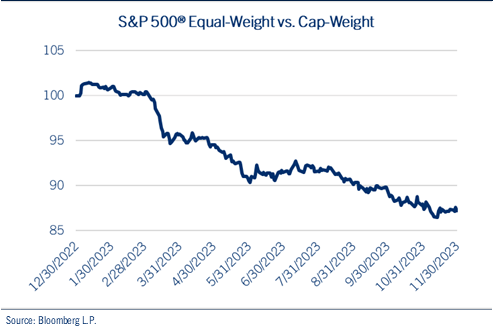
- Participation was limited as the “Magnificent Seven” drove market returns and a measure of equal-weighted S&P 500® stocks struggled to keep up with the cap-weighted Index.
- In the absence of profit growth, equity market performance for much of 2023 was driven by rising valuations, as the P/E on the S&P 500® climbed from 17.2 times at the start of the year to 20.6 times in late November.
- The equity risk premium (ERP) is near its lowest point in more than two decades and implies that the expected return for stocks is only marginally higher than the 10-year Treasury.
- Nevertheless, we look for equity market growth to approximate profit growth next year as elevated market interest rates suggest little-to-no room for P/E multiple expansion. Our below consensus S&P 500® EPS forecast of 8.0% suggests the Index would be fairly valued in the 4,750 range by the end of 2024.
Global
The global economy remains challenged on several levels.
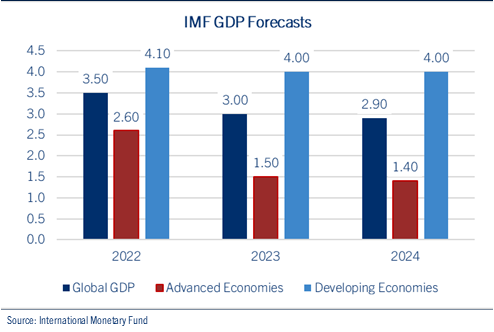
- Considering the escalation of geopolitical tensions, the IMF projects global growth to slow from 3.5% in 2022 to 3.0% this year and just 2.9% in 2024. These projections remain below the pre-pandemic path with notable weakness in several emerging economies.
- The European economy hovers near recession as inflation persists, geopolitical tensions escalate, and trade weakens. The European Central Bank (ECB) held interest rates steady and market interest rates have been volatile, though higher yields have supported the euro.
- In Japan, the economy contracted by 0.5% last quarter, at an annualized rate of -2.1%, after posting three periods of positive output. The BOJ is in the process of easing its strict yield curve control measures enabling the yen to recover marginally from multi-decade weakness. Emerging market economies remain weak, led by China’s struggles to gain traction.
- Beijing has tried a variety of stimulative measures, yet a combination of trade, debt-challenged property developers and youth unemployment continue to weigh on economic activity. The IMF lowered its forecasts for China GDP to 5.0% this year and 4.2% in 2024, factoring highly into its decision to lower its global GDP projection for next year.
Policy
The Fed may be done, but Treasury is not!
We look for policy decisions to continue to play an outsized role in economic and market performance.
Fiscal Policy
The U.S. federal budget deficit for fiscal year 2023 (September 30th) was officially tallied at $1.7 trillion, yet when adjusting for student loan vagaries, on a cash basis the total surged to ~$2 trillion. To be sure, the budget was pressured by waning pandemic stimulus, falling tax receipts and rising interest rates. Support for Ukraine also played a role, while the war between Israel and Hamas suggests the likelihood for increased outlays in fiscal 2024.
At ~6.0% of national economic output, the budget deficit is a striking development when considering full employment in the U.S. A deficit of this magnitude would make more sense during a recession, with the associated increase in joblessness. However, combining the current post-pandemic situation with escalating geopolitical tensions and rising domestic demands will likely place further pressure on the bond market in the coming quarters. See chart: Budget Deficit as % of GDP.
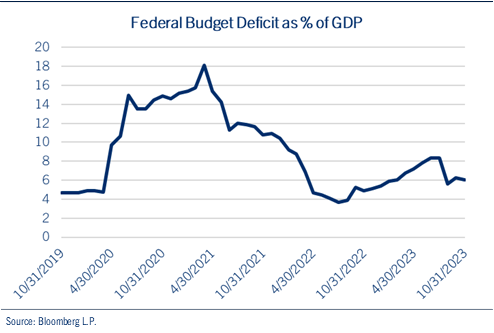
After borrowing more than $1 trillion in the fiscal fourth quarter (September 30th) the Treasury department announced expected issuance of $776 billion in the current quarter and $824 billion early next year. This excess supply will likely be met with demand restraint, as the Fed maintains its quantitative tightening campaign (balance sheet reduction) and other traditional buyers (China, Japan, and U.S. banks) have reduced their appetite for Treasuries.
Despite these developments, the financial markets reacted favorably to the Treasury Department’s plan to continue issuing debt at shorter maturities. We remain concerned that federal interest expense will consume a growing portion of future discretionary budgets. Federal debt service costs are now approaching 14% of tax revenues, a level that has historically stressed markets and prompted Congress to restrain fiscal spending.
While we avoided a government shutdown on two occasions recently, we suspect political tensions will escalate in early 2024. The hope is always that cooler heads will prevail in Washington to come up with a sufficient fiscal plan to satisfy both parties. However, in a presidential election year, its conceivable fiscal leaders dig their heels in supporting party priorities, potentially affecting investor sentiment.
Monetary Policy
The Federal Reserve held their policy rate steady (in the range of 5.25% to 5.50%) for the second consecutive meeting on November 1st, suggesting that rates would remain elevated well into next year. Recently released minutes from that meeting confirmed policymakers’ strong intent to maintain the current stance, despite market optimism about prospects for an easing of monetary conditions next year. Fed Chair Jerome Powell also noted that recent moves in market interest rates may help cool demand and relieve inflationary pressures and “is clearly a tightening of financial conditions.”
Indeed, the Fed has been very aggressive tightening credit over the past 18 months, while allowing approximately $1 trillion in maturing securities to roll off its balance sheet. As a result, some progress has been made in addressing inflation, with Core Personal Consumption Expenditures (PCE) currently running at 3.5% YOY. Yet seemingly lost on investors is the fact that the Fed's target for price stability remains 2.0%.
To the degree the Fed holds rates “higher for longer” over the next several quarters, we believe monetary policy can remain restrictive. For example, by maintaining the current policy stance, any improvement in core inflation measures will lead to higher inflation-adjusted, or “real” interest rates, which serve to tighten credit conditions in the economy. See chart: Real Interest Rates.
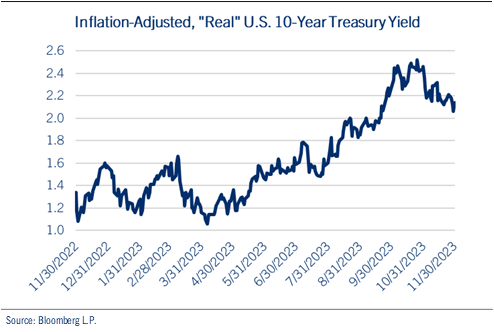
Therefore, we look for elevated market yields to exert pressure on the economy without necessitating further interest rate hikes by the Fed. This enables the central bank to tighten credit without the blunt force of interest rate hikes, particularly during an election year. Recent market activity indicates hopes for up to five rate cuts in 2024, expectations that we suspect are misguided given the improved, though elevated, measures of core inflation. The situation is fluid, influenced by both domestic economic and international political events, but our expectation is that the Fed will keep rates at current levels until inflation aligns with its target.
Presidential Election
Of course, a variety of factors can affect market sentiment in any given year. Over the next 12 months, geopolitical tensions are likely to remain high, economic growth may moderate and all eyes will be on the Federal Reserve. Yet, political headlines will escalate as the presidential primary season officially begins on January 15th in Iowa. The first half of next year will likely be fraught with speculation relative to candidates, party and platforms until the conventions conclude next summer.
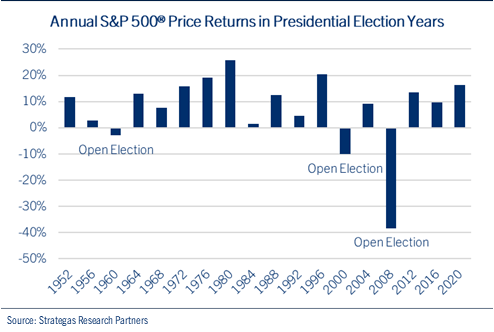
In the meanwhile, we thought it appropriate to point out (perhaps jinx) the fact that since 1952, the S&P 500® has never declined during a presidential re-election year. The only negative years were during the three “open elections” in 1960, 2000, and 2008, in which both parties offered new presidential candidates. See chart: Annual S&P 500® Returns in Presidential Election Years.
In addition, it is also interesting to note the equity market’s performance while anticipating the election’s outcome. The S&P 500® typically outperforms in presidential election years when the incumbent party wins. It stands to reason that if the economy and markets are performing, voter sentiment is likely behind the sitting president. Yet, the pattern for an incumbent loss involves two separate selloffs during the election year – during the height of primary season (early spring) and following the conventions in late-summer. See chart: S&P 500® Avg. Performance in Election Years & Incumbent Party Result.
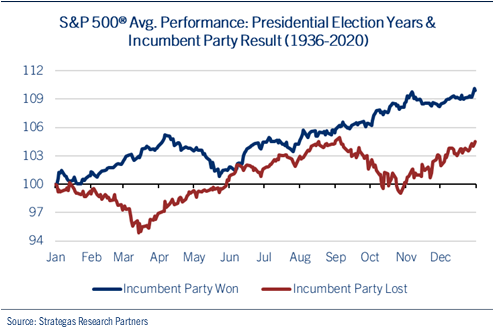
As clarity emerges on candidates and platforms in the coming months, we will provide investors with more insight relative to potential economic and market implications.
Economy
It is hard to have recession when everyone who wants a job has a job.
The U.S. economy managed to absorb a variety of challenges thus far in 2023, including higher interest rates, elevated inflation, weak manufacturing, poor leading indicators, declining corporate profits, three bank failures, volatile energy prices, rising geopolitical tensions and an “imminent recession” that failed to materialize.
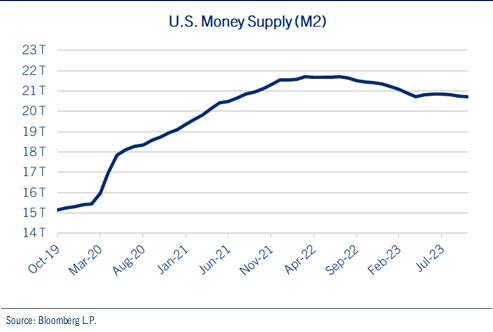
We attribute this surprising economic resilience to the growth in the money supply (M2) which despite efforts of monetary policymakers, remains ~30.0% higher than it was prior to the outbreak of Covid-19. Indeed, considering pandemic-related fiscal spending and other domestic priorities, the money supply has climbed from ~$15.5 trillion in December 2019 to ~$20.5 trillion today, providing the economy, and the financial markets, with a liquidity driven shock absorber to withstand dynamics that would have otherwise previously resulted in economic and market weakness. See chart: M2.
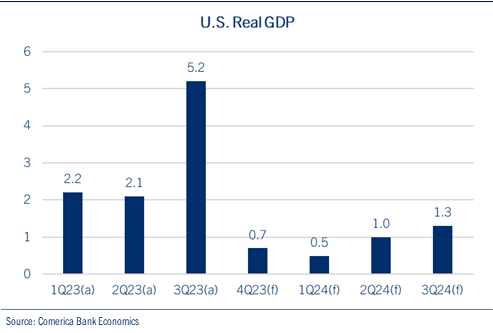
This economic resilience of 2023 was most pronounced in the third quarter, as real GDP rose 5.2% compared to the 2.1% pace for the period ending in June. While personal consumption remained strong, some concerning details were evident as business inventories rose, capital investment stalled and after-tax personal incomes weakened.
Considering the impact of rising market interest rates, the possibility of another government shutdown and escalating geopolitical tensions, it is conceivable demand moderates in the months and quarters ahead. Comerica Bank Chief Economist Bill Adams projects real GDP growth of just 0.7% and 0.5% for the fourth and first quarters, respectively. For all of 2024, he projects real GDP growth of 1.4%. See chart: U.S. Real GDP (actual and forecast).
While economic activity recently strengthened, inflationary pressures continued to moderate.
The Consumer Price Index (CPI) was unchanged in October, bringing the YOY reading down to 3.2%. Strength in food prices was offset by a drop in the costs for energy and gasoline. When excluding the costs for food and energy, core CPI rose 0.2% in October, resulting in a 4.0% YOY increase, the slowest in two years. See chart: CPI & core CPI – YOY.
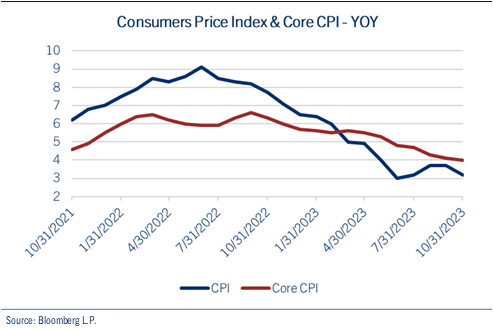
The inflation fever has broken in the U.S., according to Adams, who projects CPI growth of 2.5% next year.
The employment situation has been another source of economic strength and resilience this past year, as jobs data consistently exceeded expectations. Yet, some cracks have recently emerged as job growth decelerated in October. Non-farm payrolls increased by 150,000 and was largely impacted by the UAW strike, which resulted in an estimated loss of 35,000 jobs.
The unemployment rate came in at 3.9% and has now quietly climbed from 3.4% last spring. Average hourly earnings gains have moderated, and the labor force participation rate declined to 62.7%, marking the first drop this year. In addition, the ratio of job openings to unemployed individuals currently stands at 1.5, the lowest it has been in two years. To the degree that the Fed can reduce job openings, rather than jobs, confidence in a soft-landing grows.
We look for the unemployment rate to climb to 4.2% next year and will be closely monitoring activity in housing, manufacturing and services to see whether the U.S. economy can avoid a mild recession. Fortunately, productivity has been gaining strength (+4.7% in Q3) providing yet another shock absorber for moderating demand in the coming quarters.
Fixed Income
The Treasury Yield Curve still points to recession, but corporate bonds suggest it will not be so bad!
Investors have faced another difficult year in the bond market.
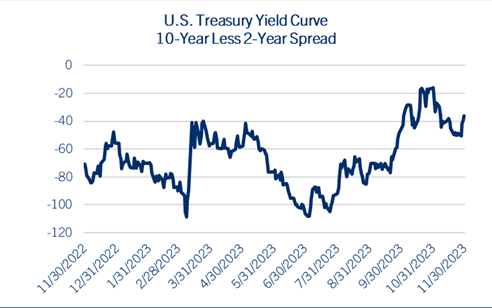
U.S. Treasury yields plunged last spring on banking industry stress before surging again over concerns of inflation and monetary policy. Curiously, market interest rates resumed their climb shortly after inflation measures troughed this summer, as a combination of persistent Fed messaging and increased federal deficit spending heightened supply fears. Indeed, Treasury Secretary Yellen’s announcement in August that fiscal fourth quarter would see Treasury issuance ~30% greater than expectations saw the benchmark 10-year Treasury climb above 5.00%, a level not witnessed in over 15 years. Though the yield differential narrowed with the 2-year Treasury bill, the Treasury yield curve nevertheless remains inverted, a traditional signpost of recession. See chart: U.S. Treasury Yield Curve.
Hopes for a soft-landing combined with escalating geopolitical tensions led to a renewed bid for government bonds. Moreover, as the U.S. Treasury announced increased borrowing over the next few quarters, plans for more shorter-dated maturities eased market concerns regarding longer-term principal risk.
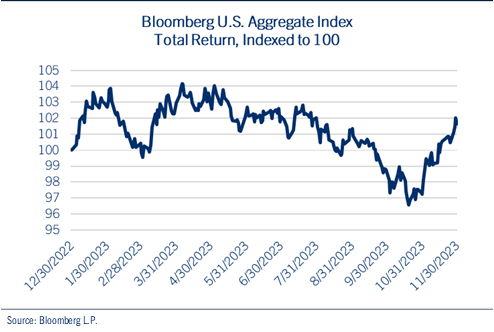
The resulting roller-coaster ride for the benchmark 10-year U.S. Treasury note this year affected all areas of the credit market, weighing on corporates, mortgages, TIPS, as well as tax-exempt bonds. After a volatile period, the broadest measure of domestic fixed income, the Bloomberg Aggregate Index, stabilized by the end of November. See chart: Bloomberg Aggregate Index.
While optimism prevails in the bond market for 2024 relative to anticipated Fed rate cuts and shorter-dated Treasury borrowing, we find ourselves less enthusiastic than the consensus.
First, it is conceivable the Fed remains steadfast in its message that rates will remain “higher for longer.” Indeed, by holding rates steady, any improvement in core inflation measures would result in higher inflation-adjusted or “real” interest rates. This would enable monetary policy makers to battle persistent price pressures with tighter credit conditions while appearing to remain on the sidelines during what is expected to be a volatile presidential election campaign.
Second, traditional buyers of U.S. Treasury debt must reconcile the sustainability of government finances amid an increased supply of bonds. Moreover, given its commitment to balance sheet reduction (quantitative tightening) the Federal Reserve is no longer supporting the Treasury market as it had over the past 15 years. China and Japan have altered their investment patterns and U.S. banks will also likely purchase fewer Treasuries given regulatory concerns over securities portfolios.
Considering the recent debt downgrade, elevated market interest rates, and less demand from traditional buyers, federal interest payments are set to rise to levels that will consume an increasing portion of future discretionary budgets.
While geopolitical tensions may provide a safe-haven bid as it has in recent weeks, longer-term trends suggest the possibility that the recent move in the 10-year Treasury note could simply prove to be a counter-trend rally. To be sure, since the peak yield in the early 1980s, the benchmark 10-year Treasury note experienced ten counter-trend rallies, none of which materialized into a trend-altering result. Of course, emergency pandemic-related fiscal spending and multi-decade high inflation readings finally did the trick. See chart: Long-Term Trend 10-Year U.S. Treasury Note.
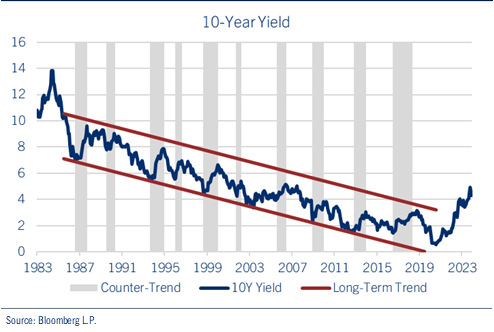
Will we need to see recession to confirm that ~5.0% yield on the 10-year Treasury note was the top?
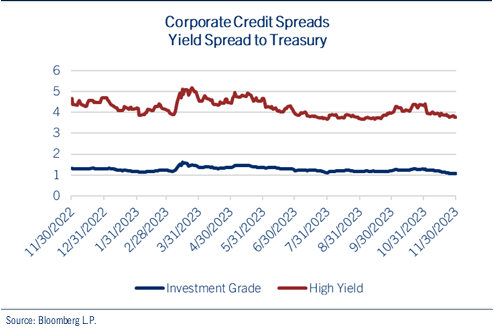
Fortunately, we continue to be encouraged that corporate credit spreads (investment grade and high yield) remain within their average bands over the past 25 years, suggesting the markets are pricing in limited default risk should economic recession materialize. See chart: Corporate Credit Spreads.
In this environment, we continue to favor short and intermediate term duration with an emphasis on credit quality in the government, corporate and tax-exempt spaces. History has displayed a tendency to support transition to longer maturities following the conclusion of a Fed tightening cycle, yet we believe it is too early given the extent of Treasury issuance and uncertainty relative to core inflation and monetary policy. After three challenging years in the bond market, we look for “coupon-type” returns to support diversified portfolios in 2024.
Equities
Regarding valuation, the “E” must substantiate the “P” in P/E ratios.
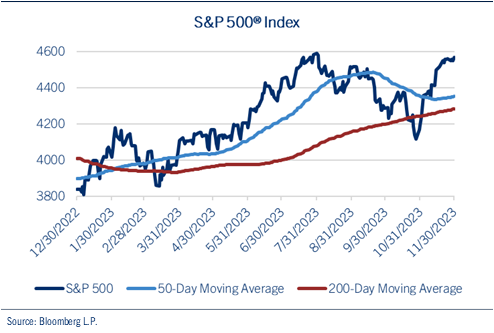
It was another volatile year in the equity markets, as optimism over declining inflation, monetary policy and artificial intelligence (AI) propelled the major indexes higher. Momentum recovered and large caps outperformed small, while growth significantly outperformed value. The equity market faced a shock with three bank failures causing the S&P 500® Index to trough around 3,850 in late March. Yet, a rapid response from fiscal and monetary policymakers eased investor concerns and equities proceeded to march higher into late summer. At that point, sentiment shifted given growing worries relative to steadfast monetary policy and increased deficit spending. Market interest rates surged, and investors began to question valuations, particularly since profits had declined for three consecutive quarters. The S&P 500® slipped into correction territory (down 10.0% from recent high) by late October, before quickly overcoming resistance levels and rallying toward new year-to-date (YTD) highs by late-November on hopes for Fed rate cuts in 2024. See chart: S&P 500® Index.
To be sure, the market’s recent response was fast and sudden. Like much of the market activity throughout the year, though, the early gains were led by a select group of mega-cap stocks. Indeed, the Magnificent Seven drove market returns throughout the year, as a measure of equal-weighted S&P 500® stocks struggled to keep up with the cap-weighted Index. For a sustainable rally to gain traction, we would like to see increased participation going forward. See chart: S&P 500® Equal-Weight vs. Cap-Weight.
In the absence of profit growth, equity market performance for much of 2023 was driven by rising valuations, as the P/E on the S&P 500® climbed from 17.2 times at the start of the year to 20.6 times in late November. It appears that equity investors continue to discount future profit growth as though interest rates were still at zero, rather than the current ~5.0% level. Fortunately, profit growth resumed in the third quarter, which was a good start to help support an improved valuation dynamic.
In addition to our concerns over participation and valuation, market interest rates have climbed to a point where the relative opportunity between stocks and bonds has narrowed significantly. See chart: Equity Risk Premium.
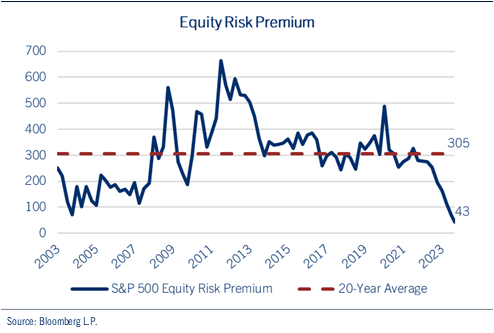
The equity risk premium (ERP) provides insights into relative valuations by measuring the earnings yield on the S&P 500® (inverse of the P/E ratio) in relation to the yield on the 10-year U.S. Treasury note. Currently, the ERP is 43 basis points, near its lowest point in more than two decades and significantly below its long-term average of 305 basis points. This situation implies that the return expected by investors from holding stocks is only marginally higher than the anticipated return on Treasuries, despite the additional risks involved. This may present a valuation challenge for equity markets in the year ahead as below average ERP readings typically presage below average, albeit positive, returns.
Despite narrow participation, elevated valuations and diminished relative opportunities vs. bonds, we look for equity market growth to approximate profit growth in 2024. The U.S. economy appears poised to avoid recession next year and we look for profit margins to stabilize. Elevated market interest rates, however, suggest little-to-no room for P/E multiple expansion.
Our projection for essentially flat EPS of ~$220.00 for the S&P 500® in 2023 should be followed by profit growth of up to 8.0% next year, with our below consensus forecast for Index EPS of ~$237.50 in 2024.
Assuming a trailing twelve-month (TTM) P/E ratio of ~20.0 times our 2023 EPS ($220.00) estimate, we believe the S&P 500® to be fairly valued in the 4,400 range currently. This fair value estimate also equates to a forward 12-month P/E of ~18.5 times our $237.50 forecast for 2024. Applying a similar TTM P/E ratio of ~20 times our $237.50 estimate suggests the S&P 500® would be fairly valued in the 4,750 range at the end of next year.
Though not our base case, should the Fed deliver on current market expectations of four interest rate cuts next year and GDP growth comes in well ahead of expectations, it is conceivable S&P profits come in around $250.00, slightly above the consensus forecast, resulting in the potential for a move to new highs in the 5,000 range sometime next year. A recession could also develop, though, bringing Index profits down toward $200.00, likely seeing the S&P 500® struggling to hold the 4,000 level during periods of heightened market volatility.
Considering our outlook for mild economic growth, a steadfast Fed, and a return to corporate profitability, we believe the most likely outcome supports the S&P 500® fairly valued in the 4,750 range by the end of next year.
Given our expectation for market growth to reflect profit growth in 2024, we largely favor sectors offering a premium to Index profit growth next year. See chart: S&P 500® Index EPS Estimates.
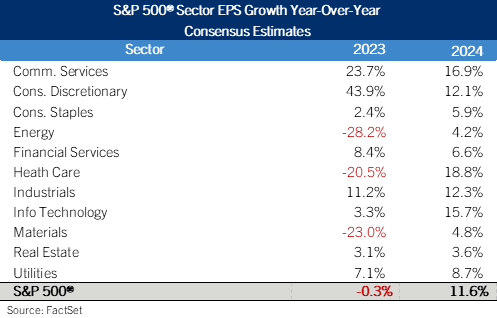
The Health Care sector offers Index leading profit estimates while also providing defensive characteristics. Technology offers good profit growth along with strong momentum and possible upside should money flows transition from the >$5 trillion in money market funds. Watch valuation in this space as improved participation would indicate early cycle performance characteristics. The Industrials sector sets up well from participation along with profitability. Though Energy’s estimated profit growth rate trails the Index, fundamentals including free cash flow are firming and fund flows remain contrarian given heightened geopolitical tensions.
While the Communications Services sector offers EPS growth, we suspect the strong YTD gains (~50.0%) accurately reflect that opportunity in an environment where elevated interest rates should begin to affect valuation for longer-duration growth stocks.
Of course, risks to this outlook include election year volatility, geopolitical tensions, stubborn inflation, a steadfast Fed, and perhaps even recession. Yet, we must play the hand we are dealt, and this continues to support diversified, long-term strategies consistent with one’s investment goals. At this point in the cycle, we favor only slight “over-weights” in stocks over bonds, large over small, cyclicals over defensives, value over growth and domestic over international.
Global
The global economy remains challenged on several levels.
The International Monetary Fund (IMF) reports that the global recovery from the pandemic and Russia’s invasion of Ukraine remains slow and uneven. Considering the escalation of geopolitical tensions, the IMF projects global growth to slow from 3.5% in 2022 to 3.0% this year and just 2.9% in 2024. These projections remain below the pre-pandemic path with notable weakness in several emerging economies. See chart: Global GDP.
War in Israel has added to the geopolitical tensions and a growing sense of nationalism around the world will likely weigh on global trade, placing further pressure on prices.
Looking at specific regions, the European economy hovers near recession as inflation persists, geopolitical tensions escalate and trade weakens. The European Central Bank (ECB) held interest rates steady at the late-October meeting, ending a record run of ten consecutive rate increases. Market interest rates have also been volatile, though higher yields have supported the euro, which has firmed against the U.S. dollar.
In Japan, the economy contracted by 0.5% last quarter, at an annualized rate of -2.1%, after posting three periods of positive output. Personal consumption was flat, and trade slipped, prompting the government to implement a $100 billion economic stimulus package. Though the Bank of Japan is in the process of easing its strict yield curve control measures (allowing market interest rates to approach 1.0%) it may struggle to battle persistent inflation, which is expected to exceed 3.0% growth through 2025. The yen has responded by recovering marginally from multidecade weakness. Of course, the weak yen has been good for Japanese stocks, which have been among the world’s leaders in 2023.
Emerging market economies remain weak, led by China’s struggles to gain traction.
Beijing has tried a variety of stimulative measures, yet a combination of trade, debt-challenged property developers and youth unemployment continue to weigh on activity. Consumer prices are slipping toward deflation, while data on both exports and imports continue to decline. The IMF lowered its forecasts for China GDP to 5.0% this year and 4.2% in 2024, factoring highly into its decision to lower its global GDP projection for next year.
Consequently, global equities have struggled this year. See chart: MSCI ACWI ex. U.S.
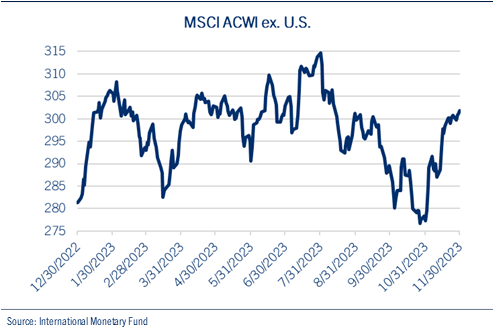
Given these global challenges, we maintain a preference for domestic over international exposures in long-term, diversified portfolios. We will revisit exposures once we see progress on economic growth, inflation, rates and currency stability.
We wish you a happy holiday season and a healthy 2024!
IMPORTANT DISCLOSURES
Comerica Wealth Management consists of various divisions and affiliates of Comerica Bank, including Comerica Bank & Trust, N.A. Inc. and Comerica Insurance Services, Inc. and its affiliated insurance agencies.
Comerica Bank and its affiliates do not provide tax or legal advice. Please consult with your tax and legal advisors regarding your specific situation.
Non-deposit Investment products offered by Comerica and its affiliates are not insured by the FDIC, are not deposits or other obligations of or guaranteed by Comerica Bank or any of its affiliates, and are subject to investment risks, including possible loss of the principal invested.
Unless otherwise noted, all statistics herein obtained from Bloomberg L.P.
This is not a complete analysis of every material fact regarding any company, industry or security. The information and materials herein have been obtained from sources we consider to be reliable, but Comerica Wealth Management does not warrant, or guarantee, its completeness or accuracy. Materials prepared by Comerica Wealth Management personnel are based on public information. Facts and views presented in this material have not been reviewed by, and may not reflect information known to, professionals in other business areas of Comerica Wealth Management, including investment banking personnel.
The views expressed are those of the author at the time of writing and are subject to change without notice. We do not assume any liability for losses that may result from the reliance by any person upon any such information or opinions. This material has been distributed for general educational/informational purposes only and should not be considered as investment advice or a recommendation for any particular security, strategy or investment product, or as personalized investment advice.
Diversification does not ensure a profit or protect against a loss in a declining market. Past performance is no guarantee of future returns. The performance of an index is not an exact representation of any particular investment, as you cannot invest directly in an index. The material is not intended as an offer or solicitation for the purchase or sale of any financial instrument. The investments and strategies discussed herein may not be suitable for all clients.
The S&P 500® Index, S&P MidCap 400 Index®, S&P SmallCap 600 Index® and Dow Jones Wilshire 500® (collectively, “S&P® Indices”) are products of S&P Dow Jones Indices, LLC or its affiliates (“SPDJI”) and Standard & Poor’s Financial Services, LLC and has been licensed for use by Comerica Bank, on behalf of itself and its Affiliates. Standard & Poor’s® and S&P® are registered trademarks of Standard & Poor’s Financial Services, LLC (“S&P”) and Dow Jones® is a registered trademark of Dow Jones Trademark Holdings, LLC (“Dow Jones”). The S&P 500®® Index Composite is not sponsored, endorsed, sold or promoted by SPDJI, Dow Jones, S&P, or their respective affiliates and none of such parties make any representation regarding the advisability of investing in such product nor do they have any liability for any errors, omissions, or interruptions of the S&P Indices.
NEITHER S&P DOW JONES INDICES NOR STANDARD & POOR’S FINANCIAL SERVICES, LLC GUARANTEES THE ADEQUACY, ACCURACY, TIMELINESS AND/OR THE COMPLETENESS OF THE WAM STRATEGIES OR ANY DATA RELATED THERETO OR ANY COMMUNICATION, INCLUDING BUT NOT LIMITED TO, ORAL OR WRITTEN COMMUNCATION (INCLUDING ELECTRONIC COMMUNICATIONS) WITH RESPECT THERETO. S&P DOW JONES INDICES AND STANDARD & POOR’S FINANCIAL SERVICES, LLC SHALL NOT BE SUBJECT TO ANY DAMAGES OR LIABILITY FOR ANY ERRORS, OMISSIONS, OR DELAYS THEREIN. S&P DOW JONES INDICES AND STANDARD & POOR’S FINANCIAL SERVICES, LLC MAKE NO EXPRESS OR IMPLIED WARRANTIES, AND EXPRESSLY DISCLAIM ALL WARRANTIES, OR MERCHANTABILITY OR FITNESS FOR A PARTICULAR PURPOSE OR USE OR AS TO RESULTS TO BE OBTAINED BY COMERICA AND ITS AFFILIATES, OR ANY OTHER PERSON OR ENTITY FROM THE USE OF THE S&P INDICES OR WITH RESPECT TO ANY DATA RELATED THERETO. WITHOUT LIMITING ANY OF THE FOREGOING, IN NO EVENT WHATSOEVER SHALL S&P DOW JONES INDICES OR STANDARD & POOR’S FINANCIAL SERVICES, LLC BE LIABLE FOR ANY INDIRECT, SPECIAL, INCIDENTAL, PUNITIVE, OR CONSEQUENTIAL DAMAGES INCLUDING BUT NOT LIMITED TO, LOSS OF PROFITS, TRADING LOSSES, LOST TIME OR GOODWILL, EVEN IF THEY HAVE BEEN ADVISED OF THE POSSIBILITY OF SUCH DAMAGES, WHETHER IN CONTRACT, TORT, STRICT LIABILITY, OR OTHERWISE. THERE ARE NO THIRD-PARTY BENEFICIARIES OF ANY AGREEMENTS OR ARRANGEMENTS BETWEEN S&P DOW JONES INDICES AND COMERICA AND ITS AFFILIATES, OTHER THAN THE LICENSORS OF S&P DOW JONES INDICES.
“Russell 2000® Index and Russell 3000® Index” are trademarks of Russell Investments, licensed for use by Comerica Bank. The source of all returns is Russell Investments. Further redistribution of information is strictly prohibited.
MSCI EAFE® is a trademark of Morgan Stanley Capital International, Inc. (“MSCI”). Source: MSCI. MSCI makes no express or implied warranties or representations and shall have no liability whatsoever with respect to any MSCI data contained herein. The MSCI data may not be further redistributed or used as a basis for other indexes or any securities or financial products. This report is not approved, endorsed, reviewed or produced by MSCI. None of the MSCI data is intended to constitute investment advice or a recommendation to make (or refrain from making) any kind of investment decision and may not be relied on as such.
FTSE International Limited (“FTSE”) © FTSE 2016. FTSE® is a trademark of London Stock Exchange Plc and The Financial Times Limited and is used by FTSE under license. All rights in the FTSE Indices vest in FTSE and/or its licensors. Neither FTSE nor its licensors accept any liability for any errors or omissions in the FTSE Indices or underlying data.comerica.com/insights


