
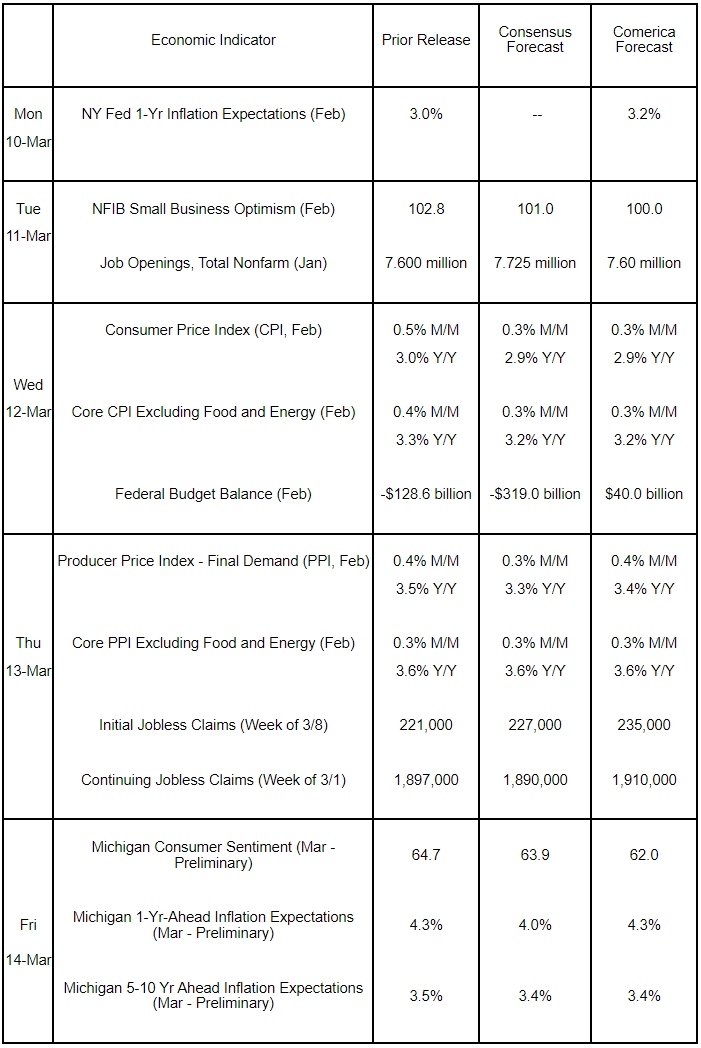
Preview of the Week Ahead
Inflation data will dominate the economic calendar this week. The total and core Consumer Price Indexes (CPI) likely rose at a more moderate pace in February after sharp increases in the prior month, resulting in annual increases holding roughly steady. Pushed higher by tariffs and tariff threats, producer prices probably rose faster than consumer prices for a second month running, keeping annual PPI elevated. The federal government’s budget balance likely turned positive last month for the first time in the current fiscal year. Small business optimism probably eased. The New York Fed’s consumer survey is expected to show rising inflation expectations, as is the University of Michigan’s, where the overall economic outlook likely dimmed in early March.
The Week in Review
Nonfarm employment rose by a cool 151,000 in February and matched Comerica Economics’ forecast. Job growth in December and January was revised down by a slight 2,000. Private education and healthcare accounted for about half of jobs added, with additional gains in financial activities, construction, transportation and warehousing. The federal government, leisure and hospitality, retail, and temp jobs fell. The unemployment rate edged up to 4.1%, and details of the survey of households were weaker than this headline. The labor force participation rate eased two tenths of a percentage point to 62.4% and was the lowest since January 2023. The average work week was unchanged at 34.1 hours, tying for the lowest since 2010. Private service-providing industries accounted for the weakness in hours worked in the past two months. Average hourly earnings rose 0.3% on the month and were up 4.0% from a year earlier. February’s soft report is disappointing since it followed an even weaker one during January’s snowstorms and wildfires. Job growth usually bounces back quickly after storms and natural disasters, but not this time.
The ISM Manufacturing PMI retreated in February and pointed to marginal growth. The underlying details were weak: Production fell, new orders plummeted, and employment fell. Manufacturers’ input costs rose the fastest since mid-2022. The services sector fared better, with the ISM Services PMI recovering after the wildfires and weather weighed on it in January. Services production grew a little slower, but remained comfortably in expansionary territory. New orders and employment grew, while prices rose at a faster pace. Both surveys’ commentaries mention worries about tariffs across most industries.
The trade deficit in goods and services widened to a record $131.4 billion in January from $98.1 billion in December, near Comerica Economics’ forecast. A $33.5 billion deterioration in the goods deficit drove the record shortfall. Importers front-loaded purchases to avoid higher tariffs. The services surplus edged up $0.2 billion. The U.S. recorded trade deficits with all four of its largest trade partners in 2024. The trade deficits with China, Mexico, and the European Union were $263 billion, $179 billion, and $161 billion, respectively, while the shortfall with Canada was $36 billion. Per capita, China imported the least from the U.S. last year, averaging just around $140 per person. The European Union imported $1,450 worth of U.S. goods and services per person, while Mexico purchased nearly $3,000 per head. Canada imported the most, buying approximately $10,600 worth of U.S. goods and services per Canadian last year.
For a PDF version of this publication, click here: Comerica Economic Weekly, March 10, 2025
The articles and opinions in this publication are for general information only, are subject to change without notice, and are not intended to provide specific investment, legal, accounting, tax or other advice or recommendations. The information and/or views contained herein reflect the thoughts and opinions of the noted authors only, and such information and/or views do not necessarily reflect the thoughts and opinions of Comerica or its management team. This publication is being provided without any warranty whatsoever. Any opinion referenced in this publication may not come to pass. We are not offering or soliciting any transaction based on this information. You should consult your attorney, accountant or tax or financial advisor with regard to your situation before taking any action that may have legal, tax or financial consequences. Although the information in this publication has been obtained from sources we believe to be reliable, neither the authors nor Comerica guarantee its timeliness or accuracy, and such information may be incomplete or condensed. Neither the authors nor Comerica shall be liable for any typographical errors or incorrect data obtained from reliable sources or factual information.
